
Trends in Undocumented Child Arrivals Amid Ongoing DACA Uncertainty

Fast Facts
- Undocumented child arrivals in the United States hit a nearly 20-year high with 189 arriving in 2023 alone—but since 2017, a Trump-era freeze has blocked new DACA applications. How might this rescission affect newly arrived undocumented children?
- Undocumented child arrivals plunged during the Great Recession and stalled amid the pandemic—then skyrocketed to a 20-year peak in 2023. What’s driving this surge after years of uncertainty?
Uncertainty now defines daily life for young immigrants once shielded by Deferred Action for Childhood Arrivals (DACA). After the Trump administration’s 2017 decision to end new applications, no new arrivals have been eligible to enter the program since. For many youth raised in the U.S., this has meant living with precarity, unsure whether the program offering work permits and relief from deportation will persist or end with the next legal decision.
Undocumented child arrivals aged 0–15 in the last 18 months declined from 138 in 2005 to below 100 by 2010 and stayed low through 2016. This steep drop coincided with the onset of the Great Recession (2007–2009), which likely discouraged migration by reducing job opportunities and increasing uncertainty for families. When the DACA program was created in June 2012, arrivals began to steadily increase. However, after new DACA applications were halted in 2017, arrivals remained stable but low, fluctuating between 93 and 106 annually through 2019. In 2020, there was a significant drop in undocumented child arrivals, falling to 75 from 106 in 2019. This decline coincided with the onset of the COVID-19 pandemic, which severely disrupted migration patterns due to widespread border closures, travel restrictions, and increased enforcement measures.
Methodology
These estimates derive from a methodology developed in collaboration with the Migration Policy Institute that uses administrative data and data from the U.S. Census Bureau’s American Community Survey (ACS) to estimate the size of the unauthorized immigrant population. To learn more, go here. [The methodology subtracts the number of legal immigrants of all categories, counted in administrative data, from the total count of the foreign born in the ACS, to estimate the number of unauthorized immigrants. The methodology also adjusts for the fact that the ACS has historically undercounted recently arrived immigrants. Information about detailed immigration statuses were compiled from estimates produced by the Migration Policy Institute.]
Posted: March 30th 2026
When the Economy Shifts, Migration Moves–A Close Look at Undocumented Immigration Flows Across Economic Cycles

Fast Facts
- What happens next if the economy shifts again? Past patterns show undocumented migration closely tracks economic cycles—rising when jobs grow, like the early 2000s, and dropping fast during downturns, such as the 1.5 million decline after the Great Recession.
- COVID‑19 didn’t just freeze out‑migration — it slammed the brakes on entries, too. Both in‑ and out‑migration slowed during the pandemic, but as it eased and demand for service workers grew, inflows rose sharply while outflows stayed low.
What drives undocumented migration? For years, discussions about borders, jobs, and migration enforcement have turned on questions of who comes and goes, and why. A 20-year look at migration flows reveals just how tightly these movements mirror the economy’s cycles: when conditions improve, in-migration rises; when the economy slows, so do departures.
During the early 2000s, a period of rapid economic growth, migration inflows were high and outflows were low among undocumented foreign-born individuals. With the onset of the Great Recession, however, work opportunities evaporated. In-migration dropped, out-migration spiked, and the unauthorized population declined by 1.5 million in the space of just two years. As the economy recovered in the years that followed, inflows gradually increased but remained below earlier peaks.
Both in- and out-migration slowed again during the COVID-19 pandemic. But as the pandemic stabilized and demand for service workers grew, migration inflows rose significantly while outflows have stayed relatively low.
Methodology
These estimates derive from a methodology developed in collaboration with the Migration Policy Institute that uses administrative data and data from the U.S. Census Bureau’s American Community Survey (ACS) to estimate the size of the unauthorized immigrant population. To learn more, go here. [The methodology subtracts the number of legal immigrants of all categories, counted in administrative data, from the total count of the foreign born in the ACS, to estimate the number of unauthorized immigrants. The methodology also adjusts for the fact that the ACS has historically undercounted recently arrived immigrants. Information about detailed immigration statuses were compiled from estimates produced by the Migration Policy Institute.]
Posted: April 15th 2026
Crisis in Venezuela Drives Uptick in Migration to the U.S.
Fast Facts
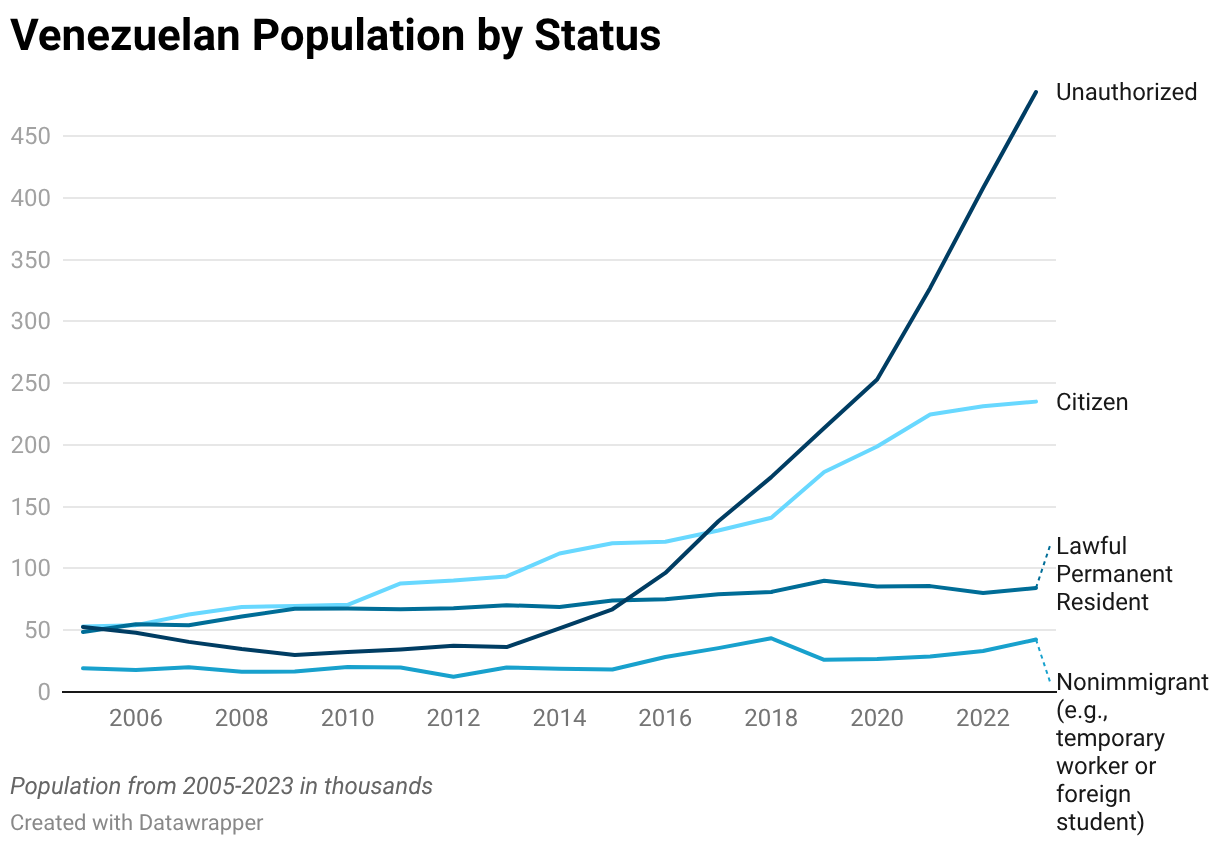
- In 2023, the majority (57%) of the foreign-born Venezuelan population in the United States was unauthorized. Foreign-born U.S. citizens accounted for 28%, lawful permanent residents 10%, and non-immigrants (e.g, students, temporary workers) 5%.
- In 2017, the unauthorized Venezuelan immigrant population in the U.S. became the largest category, nearly tripling since 2014 to reach 138,000, surpassing the number of naturalized citizens, which was 130,000.
- Temporary Protected Status (TPS) is a program administered by the Department of Homeland Security that grants temporary lawful status to migrants from certain countries facing conditions that make it unsafe or difficult for them to return home. Venezuelans were TPS recipients as of March 2025.
Since 2014, hyperinflation and political turmoil have uprooted millions of Venezuelans. When oil prices plummeted that year, Venezuela’s oil-dependent economy went into free-fall, sparking a crisis that by late 2017 had pushed inflation to 50% per month. Over the past decade, living standards have collapsed dramatically, contributing to a mass migration of Venezuelans seeking better opportunities abroad. In response, the number of unauthorized Venezuelan immigrants in the United States grew from an estimated 51,000 in 2014 to nearly half a million by 2023.
Before 2023, the majority of foreign-born Venezuelans in the U.S. were lawful permanent residents or naturalized citizens. While those populations remained relatively stable over time, the number of unauthorized Venezuelan immigrants grew significantly.
Many of these immigrants (237,000) were granted Temporary Protected Status (TPS), a program that provides temporary protection from deportation and work authorization to individuals from countries experiencing unsafe conditions like armed conflict or natural disasters. We classify those with TPS as “unauthorized” because of the precarity of their status. Under the second Trump administration, the Department of Homeland Security determined that Venezuela no longer meets the conditions for its designation for Temporary Protected Status (TPS), and in October 2025, the Supreme Court allowed the termination to take immediate effect.
Methodology
These estimates derive from a methodology developed in collaboration with the Migration Policy Institute that uses administrative data and data from the U.S. Census Bureau’s American Community Survey (ACS) to estimate the size of the unauthorized immigrant population. To learn more, go here. [The methodology subtracts the number of legal immigrants of all categories, counted in administrative data, from the total count of the foreign born in the ACS, to estimate the number of unauthorized immigrants. The methodology also adjusts for the fact that the ACS has historically undercounted recently arrived immigrants. Information about detailed immigration statuses were compiled from estimates produced by the Migration Policy Institute.]
Posted: May 20th 2026